Manual Reference Pages - lglin (3)
NAME
lglin(3f) - [M_calcomp:scientific] draw polyline in log-log or semi-log mode (LICENSE:PD)
CONTENTS
Synopsis
Description
Options
Example
License
SYNOPSIS
subroutine lglin(xarray,yarray,npts,inc,+-lintyp,inteq,logtyp)
DESCRIPTION
LGLIN(3f) is a FORTRAN subroutine used to plot data either in log-log or semi-log mode. LGLIN(3f) is similar in operation to LINE(3f).
OPTIONS
XARRAY,YARRAY are the arrays containing the variables to be plotted as abscissa and ordinate, respectively; either logarithmic or linear, depending on the value of LOGTYP. They also contain the scaling parameters. NPTS is the number of points to be plotted. INC is the increment between elements in the array to be plotted. INC>1 if the values to be plotted are in a mixed array. (Usually INC = 1). LINTYP is used to control the type of graph produced: If LINTYP = 0 a line is plotted between successive data points. No symbols are plotted.If LINTYP = 1 a line plot is produced, with a symbol at each data point.
If LINTYP = n a line plot is produced, with a symbol at every nth data point.
If LINTYP = -n, connecting lines are not plotted between data points; a symbol appears at every nth data point.
INTEQ is the integer equivalent used to specify the symbol to be plotted at a data point. (Refer to the description of SYMBOL for possible values of INTEQ.) LOGTYP is a code specifying the type of plot. If LOGTYP is:-1, a semi-log plot, logarithmic in X and linear in Y is produced;
0, a log-log plot is produced;
+1, a semi-log plot, linear in X and logarithmic in Y is produced.
COMMENTS
The arrays XARRAY and YARRAY must be dimensioned with at least NPTS + 2 elements. The adjusted minimum values and the delta values (normally provided by the SCALG subroutine for logarithmic data and by the SCALE subroutine for linear data) must be stored in the data arrays.
For the X array, the adjusted minimum is stored in XARRAY (NPTS*INC + 1), and the adjusted delta is in XARRAY (NPTS*INC + INC + 1). Similarly, for the Y array, the minimum is in YARRAY (NPTS*INC + 1), and the delta is in YARRAY (NPTS*INC + INC + 1). Therefore, XARRAY and YARRAY must be dimensioned to be at least NPTS*INC+INC+1 words long.
If scaling is not required, the user must place the appropriate minimum and delta values in the specified locations in the arrays. For linear arrays, these values should be 0.0 (minimum) and 1.0 (delta), to ensure a one-to-one correspondence between array data and plotted data.
EXAMPLE
Sample program:
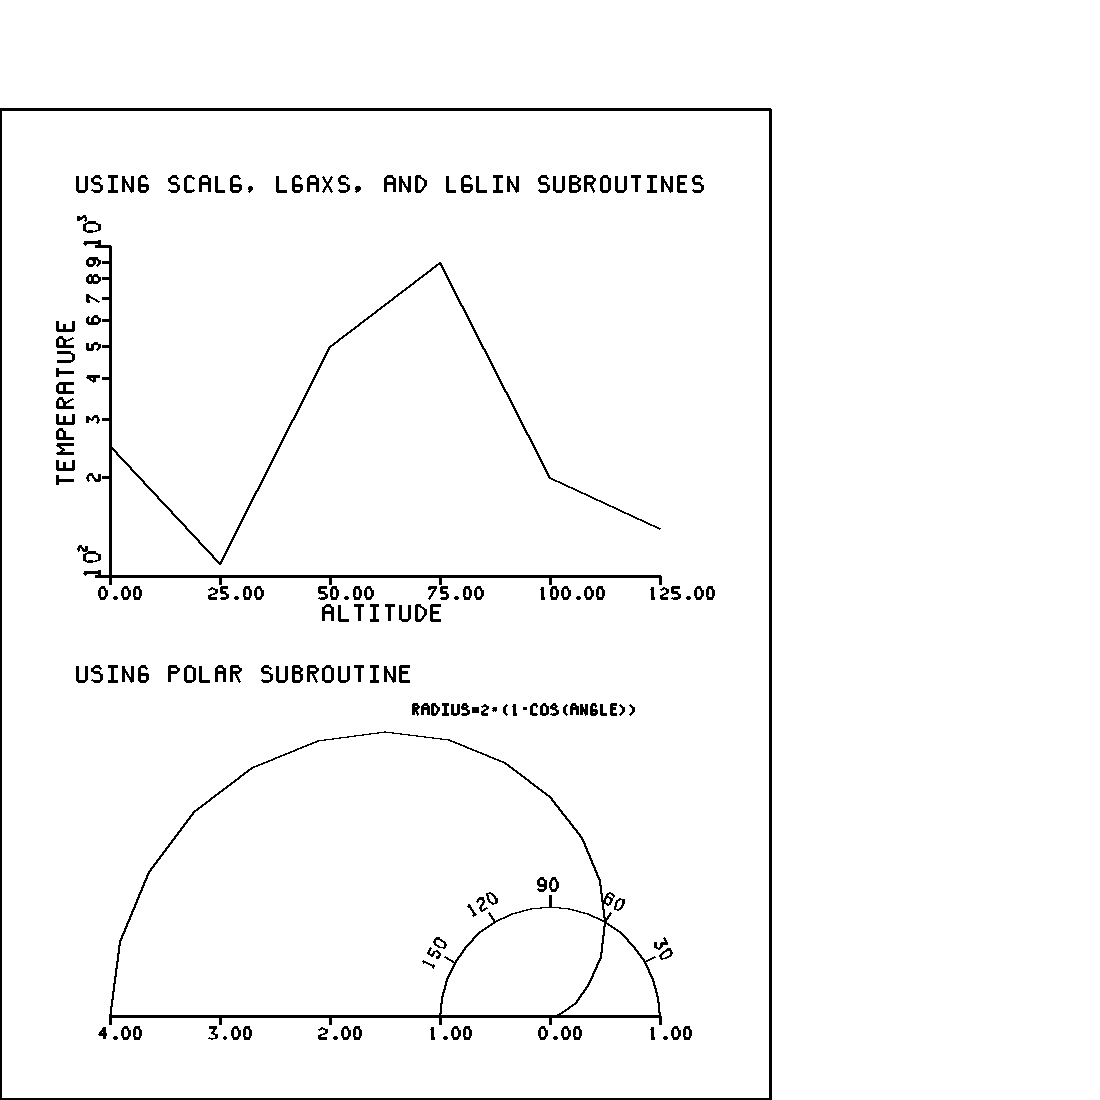
   program demo_lglin
   use M_calcomp
   implicit none
   ! based on concepts of CALIFORNIA COMPUTER PRODUCTS, 1968
   character(len=50) :: ibcd
   integer           :: i, k
   integer           :: inteq
   real              :: a
   real              :: angl
   real              :: angle(19)
   real              :: bang
   real              :: beta
   real              :: r(19)
   real              :: theta
   real              :: x
   real              :: xx
   real              :: xa,ya, xb,yb, xc,yc, xd,yd
   real              :: xar(8)= [ 1.00, 2.00, 3.00, 4.00, 5.00, 6.00       , 0.0, 0.0 ]
   real              :: yar(8)= [ 250.0, 110.0, 500.0, 900.0, 200.0, 140.0 , 0.0, 1.0 ]
      call plots(0.0,10.0,0.0,10.0)
   ! DRAW FRAME
      call plot(7.0,0.0,2)
      call plot(7.0,9.0,2)
      call plot(0.0,9.0,2)
      call plot(0.0,0.0,2)
   ! DRAW COMMENTS
      ibcd=’USING SCALG, LGAXS, AND LGLIN SUBROUTINES’
      call symbol(0.7,8.25,0.14,ibcd,inteq,0.0,42)
      ibcd=’USING POLAR SUBROUTINE’
      call symbol(0.7,3.80,0.14,ibcd,inteq,0.0,22)
   ! AXIS IS DRAWN
      ibcd=’ALTITUDE’
      call axis(1.0,4.75,ibcd,-8,5.0,0.0,0.0,25.0)
      call scalg(yar,3.0,6,1)
      ibcd=’TEMPERATURE’
      call lgaxs(1.0,4.75,ibcd,11,3.0,90.0,yar(7),yar(8))
      call scale(xar,5.0,6,1)
      call plot(1.0,4.75,-3)
      call lglin(xar,yar,6,1,0,1,1)
      call plot(-1.0,-4.75,-3)
   ! POLAR SUBROUTINE IS USED
      x=0.0
      do k=1,19
         theta=x*0.0174533
         r(k)=2.0*(1.0-cos(theta))
         angle(k)=theta
         x=x+10.0
      enddo
      call plot(5.0,0.75,-3)
      call polar(r,angle,19,1,0,1,0.0,1.0)
      angl =30.0
      a=1.0
      do  i=1,5
         theta=angl *0.0174533
         xa=cos(theta)
         ya=sin(theta)
         call plot(xa,ya,3)
         xb=1.1*xa
         yb=1.1*ya
         call plot(xb,yb,2)
         xc=xb+0.05*xa
         yc=yb+0.05*ya
         if((i-3).gt.0)then
            a=1.5
         endif
         beta=1.570797-theta
         xd=xc-0.105*a*cos(beta)
         yd=yc+0.105*a*sin(beta)
         bang=270.0+angl
         call number(xd,yd,0.105,angl, bang,-1)
         angl =angl +30.0
      enddo
      xx=0.0
      do i=1,19
         angle(i) = xx*0.0174533
         r(i) = 1.0
         xx=xx+10.0
      enddo
      call polar(r,angle,19,1,0,1,0.0,1.0)
      call plot(-5.0,-0.75,-3)
   ! AXIS IS DRAWN
      ibcd=’’
      call axis(1.0,0.75,ibcd,-1,4.0,0.0,4.0,-1.0)
      call axis(5.0,0.75,ibcd,-1,1.0,0.0,0.0,1.0)
      ibcd=’RADIUS=2*(1-COS(ANGLE))’
      call symbol(3.75,3.5,0.09,ibcd,inteq,0.0,23)
      call plot(11.0,0.0,999)
   end program demo_lglin
LICENSE
Public Domain
| lglin (3) | March 11, 2021 |